
By Kevin Reilly, ASA | evcValuation
Click HERE to download a PDF version of this article
In valuing the assets in a business transaction, economic obsolescence (“EO”) is an often difficult and sometimes contentious form of depreciation to identify, quantify, and explain. It is not something you can see, touch, hear, smell, or taste. Because it is not apparent to the senses, many appraisers find it hard to assess or sometimes even acknowledge. Yet, it is imperative that appraisers consider EO whenever using the cost approach to value the assets of an operating property or business, particularly one with significant tangible assets.
The purpose of this paper is twofold:
- Discuss basic EO concepts and how to apply them in a business valuation, and
- Present an actual situation in which EO was identified, quantified, and applied in a case study.
It is important for an appraiser to understand that there is no one correct way to quantify and apply EO in a valuation setting; rather, there are many potential methodologies and procedures that may apply. An appraiser must understand both the assets being valued and the market in which they exist.
Elements of a Business Enterprise
To understand the assets being valued within a business, the appraiser must fully understand what constitutes a business enterprise. When valuing a business, estimates are made of the income generated by the business and of the related expenses that might be incurred. Resulting net operating income can then be capitalized at an appropriate rate to indicate the value of the property as an operating business. The capitalization rate represents the relationship between net annual operating income produced by an asset or asset group and the underlying cost of investor capital, both debt and equity. The rate considers risk, availability of financing, and current market conditions.
A business enterprise valuation is developed based on the principle of anticipation of prospective economic benefits derived from the present worth of future cash flows. It entails the estimation of future revenues and associated expenses, capital requirements, and working capital needs necessary to generate and support the anticipated revenue stream. This economic analysis is used to establish the expected cash flows, which when discounted result in an indication of the value of the operating business.
In its textbook, Valuing Machinery and Equipment: The Fundamentals of Appraising Machinery and Technical Assets,[1] the Machinery and Technical Specialties Committee of the American Society of Appraisers (“the M&TS Committee”) defines a business enterprise as “all tangible assets (property, plant, equipment [that is, plant machinery and equipment], and working capital) and intangible assets of an operating business. It represents the value of the total invested capital of the business, composed of long-term debt and stockholders’ equity.” The following illustration shows the assets that compose business enterprise value:

Working capital is the difference between current assets and current liabilities. It represents the amount of cash and cash equivalents such as inventory and supplies that must be on hand to operate a business, less short-term debt, accounts payable, and accrued expenses. Tangible assets are assets such as land, buildings, and machinery and equipment. Intangible assets include the assembled and trained workforce and management team, computer software, emission credits, and operating manuals and procedures, among others.
The valuation of an operating property as a business may be determined by use of the income approach through application of a discounted cash flow (“DCF”) analysis. This analysis measures the direct economic benefits derived from ownership in the form of cash inflows and outflows attributed to the property, stated at their present value, and results in a business enterprise value (“BEV”).
As part of an operating business, the aggregate value of all the tangible and intangible assets should not exceed the value of the BEV. If initial indications of value for the underlying assets exceed the value of the operating business enterprise, the assets are nominally overvalued. Therefore, EO likely exists and should be investigated, measured, and applied against the appropriate assets.
In general, EO should be evaluated whenever an assembled group of assets is valued and the cost approach is used in some manner in the valuation process. EO normally exists when the economics of the business, as reflected by the value of the total invested capital, does not provide a fair return on the assets valued (and the value of any assets of the business not separately valued) unless a reduction in value is made to those assets. Since the income and market approaches intrinsically include all forms of obsolescence, adjustments for overall EO are normally made to only those assets valued relying on the cost approach. One caveat to the adjustment calculation is that the amount of the downward adjustment cannot reduce the value of any asset below its value in exchange (floor value).
The challenge for most appraisers when valuing assets within an operating property or business is to determine the following:
- Does EO exist?
- How much EO exists?
- How to best quantify it?
- How should it be applied in the cost approach?
The Cost Approach
Overview
In the cost approach, the maximum value of the subject property to a knowledgeable buyer is that amount currently required to erect or construct a new plant of equal utility. The current cost new must be reduced to reflect the physical deterioration, functional obsolescence, and economic obsolescence attributable to the property at the appraisal date.
The cost approach is summarized as follows:
- Cost of Replacement
- Less Physical Deterioration
- Less Functional Obsolescence due to Excess Operating Expenses
- Less Economic Obsolescence
- Less Curable Deterioration and Curable Obsolescence
- Less Curable Functional/Economic Obsolescence due to Necessary Expenditures
- Equals Cost Approach Indicator of Value
The principles behind each of these items are explained in the following section.
Explanation of Cost Approach Principles
To determine value using the cost approach, the appraiser must understand the principles behind it. The terms from the preceding cost approach summary are defined below.
Cost of Replacement
Representing the cost of a replacement facility, cost of replacement (“COR”) is defined as the estimated amount, at current market prices, required to replace the subject property at one time with a modern new unit using modern technology and construction materials that will provide the production capacity and utility of the subject property at current market prices. Thus, the COR is normally considered the upper limit of value for the cost approach portion of an appraisal.
Physical Deterioration
Physical deterioration is defined as the loss in value resulting from wear and tear in operation and exposure to the elements. Physical deterioration is a result of past service experience and maintenance practice; exposure to the natural elements or the production area atmosphere; less obvious internal defects due to vibration and operating stress; and the effects of prolonged shutdowns, accidents, and disasters. Other indications are continual demands for maintenance, with repair costs running much above the average for similar property, or below-average costs that indicate the possibility of deferred maintenance and increased deterioration.
Functional Obsolescence due to Excess Operating Expenses
Functional obsolescence due to excess operating expenses, frequently termed “operating obsolescence,” is a penalty that the existing property incurs if the subject property has higher operating expenses than would be necessary in a modern plant. It is measured by the present value of the excess operating expenses from continued operation of the existing property compared to the modern plant.
Economic Obsolescence
Economic/external obsolescence is defined as a form of depreciation, or an incurable loss in value, caused by unfavorable conditions external to the property such as the local economy, economics of the industry, availability of financing for the type of assets being valued, encroachment of objectionable enterprises, loss of material and labor sources, lack of efficient transportation, shifting of business centers, passage of new legislation, and changes in ordinances.
Curable Deterioration and Obsolescence
Curable deterioration and curable obsolescence represent economically practical repairs and maintenance that are possible to maintain or increase the utility of the subject property.
Curable Functional/Economic Obsolescence due to Necessary Capital Expenditures
Curable functional/economic obsolescence due to necessary capital expenditures represents costs that would be required by a buyer or seller to keep the subject property operating into the future. These expenditures are typically required by the government to keep the property in operation.
Cost Approach Indicator of Value
The cost approach indicator of the value of the improvements represents the COR less all forms of depreciation and obsolescence.
Economic Obsolescence
One of the first challenges an appraiser must address is whether or not EO is typically present within an industry. Appraisers sometimes specialize in one industry, a particular service, or a limited number of industries and services. This focus allows them to develop an intimate knowledge of the current market and the environment in which the assets operate.
As previously mentioned, EO is defined as an incurable loss in value, caused by unfavorable conditions external to the property, such as the local economy, economics of the industry, availability of financing, encroachment of objectionable enterprises, loss of material and labor sources, lack of efficient transportation, shifting of business centers, passage of new legislation, and changes in ordinances. EO also may be caused by a reduced demand for the product; overcapacity in the industry; dislocation of raw material supplies; increasing costs of raw materials, labor, utilities, or transportation, while the selling price remains fixed or increases at a much lower rate; foreign competition; legislation; and environmental considerations.
One example of EO would be the enactment of regulations and the imposition and enforcement of pollution controls and the resulting operating restric¬tions. These factors can result in an economic reduction in value due to added investment requirements or increased operating expenses with no offsetting revenue increases. The most extreme form of EO results in the closure of an entire plant or business unit due to insufficient market demand or because of noncompliance with regulatory environmental standards.
It is significant to note that EO factors may appear early in the property’s life and may occur without regard to the owner/operator’s previous operations and experience within the industry. These factors occur because they are outside the scope of the property owner’s influence and control.
Methods used to Quantify Economic Obsolescence
A wide variety of methods can be used to measure EO. The previously cited M&TS Committee textbook, Valuing Machinery and Equipment, discusses several methods. One of these, the measurement of inutility, is described as follows:
Whenever the operating level of a plant or an asset is significantly less than its rated or design capability, and the condition is expected to exist for some time, the asset is less valuable than it would otherwise be. Such a penalty for inutility can be a measure of the loss in value from this form of economic obsolescence.[2]
In addition, the M&TS textbook presents a variety of other methods:
It should be noted that other measures of economic obsolescence can be developed based on the following:
- Analyses of industry returns – compare the returns on invested capital in the industry the subject property operates in to returns of general or all industries.
- Supply/demand relationships – determine if competition is increasing because of a surplus of supply or a decline in demand, causing margins to decline; develop a relationship showing a supply/demand imbalance or a trend showing increasing supply over demand.
- Gross margin analysis – compare the gross margins (product price less raw material cost) of the past to current gross margins, show how gross margins are declining.
- Product or raw material price changes – show how margins are declining because the product price is stable, while the raw material prices are increasing, resulting in a decline in earnings (see gross margin analysis above).
- Stock prices – compare the stock price of companies in the subject industry to a benchmark such as the company net book to a similar ratio in the general market to show a lower stock price/net book ratio for stocks in the subject industry.
- Sales transactions – calculate the magnitude of economic obsolescence for a similar property acquired in the market by comparing the cost indicator of value prior to deducting economic obsolescence to the actual sales price. (The difference is economic obsolescence.)
- The relationship between replacement cost new and the cash flows the hypothetical replacement facility is capable of generating – compare the replacement cost new to the income indicator of value for the same property; the difference is economic obsolescence.
- Other economic evidence indicating that the value of the subject property has been reduced by external factors – look for indications of reduced earnings, reduced utilization, changes in use, idle or shutdown plants in the industry or a restructuring within the industry, among others.[3]
Understanding the potential for the existence of EO helps the appraiser decide which method to use to determine the magnitude of EO.
An often-used catch-all technique for quantifying EO is the income/earnings shortfall method. This method quantifies EO through an income approach analyzing the earnings of the overall property to determine if those earnings support a fair return on the underlying value of all individual assets of the property.
To apply this method, the appraiser develops an income approach analysis to estimate the overall value of the property. From this overall property value, adjustments are then made to subtract the value of owned land and any other assets of the property that were valued using an approach other than the cost approach. The result provides the amount of overall property value that remains available for those assets that were valued using the cost approach. A comparison of the residual overall property value to the preliminary value of the cost approach assets, before consideration of EO from an income shortfall method, dictates whether a further EO deduction to the cost approach assets is required as a result of the income shortfall method. For example, if the residual overall property value is $100 and the preliminary value of the cost approach assets is $80, the cost approach asset preliminary value is less than the residual overall property value and no further adjustment is required. However, if the preliminary value of the cost approach assets was $120, this would generally require an income shortfall EO adjustment of the cost approach assets down to $100.
Because of the close tie into the income approach, particularly when the preliminary value of the cost approach assets is greater than the residual property value, the use of this method has been the subject of debate by appraisers, some of whom claim that it diminishes the independence of the cost approach analysis. Therefore, in today’s economic environment, some appraisers avoid the use of the income shortfall method in certain valuation settings. But when it is used to quantify EO, appraisers are normally encouraged to consider and quantify other forms of EO first, and to use market-derived income approach inputs rather than property-centric inputs.
Measuring and Applying Economic Obsolescence
The appropriate application, or “push down,” of EO to assets or asset groups is determined by reference to the various approaches used to value the assets.
Asset values derived by direct reference to market pricing (a market approach) include the effects of economic obsolescence because the willing buyer and willing seller that set such prices would include this information in their negotiations.
An income approach to value is based on the projected profitability of the asset and incorporates the expected economic circumstances directly in the value estimate. Therefore, the income approach also provides a value indication that fully reflects the internal and external obsolescence factors present.
Under the cost approach, the COR must be adjusted not only for physical and functional depreciation, but also for the factors external to the asset and its cost. These external factors, or elements of external obsolescence, must be accounted for through an adjustment process before an opinion of an asset’s value can be expressed.
Case Study
The preceding commentary on the determination of EO and its role in the cost approach can be illustrated by taking a look at a case study.
The case studied here is a valuation in the power generation industry. The facility involved in this sample business transaction was a stand-alone natural-gas-fired combined cycle gas turbine (“CCGT”) power plant. The plant was designed to operate as an intermediate-load facility. The site was originally constructed in the 1960s and operated as a coal-fired base-load power plant. In the early 2000s, the facility was converted into its current configuration. All of the equipment was new except the steam turbine, which was a part of the original coal-fired facility. The thermal efficiency (heat rate) for the subject, because of its hybrid design, was high. At the date of the appraisal, the plant was currently utilized as a peaking plant (used only when the demand for electricity is high, and the price of electricity also is high).
The subject’s market was heavily concentrated with base-load generation such as coal and nuclear power generation facilities. Over the last few years, coinciding with the US economic downturn, electricity demand has significantly decreased and base-load generation is now adequate. Therefore, demand has significantly decreased for peaking generation such as that provided by the subject facility. As a result of this demand decrease, comparing the current generation of a peaking plant with its design and/or historical generation in normal markets leads to a good indicator of EO.
During the analysis of this facility, it was determined that the income approach indicator of value for the tangible assets (business enterprise value less working capital, intangible assets, and land value) was $40,700,000.
A cost approach indicator of value before EO was calculated for the improvements, and the result was $163,000,000, as shown below. This result indicates that a significant amount of EO was present.

Inutility Analysis
After consideration of the income approach indicator and the factors involved in the cost approach, an inutility analysis was used to estimate EO for the subject facility. In the inutility analysis, the net generation for 2009 was compared with expected net generation as if the plant was operating as it was designed, that is, as an intermediate- or cyclic-load plant with a 50% capacity factor. In addition, the best three-year historical average (2001, 2002, and 2007), the all-year average (2001-2009), and the best one year (2002) also were considered as benchmarks in the analysis.
Net generation was calculated by multiplying the expected capacity by a capacity factor (utilization percentage) and by the total hours in a year. For instance, the capacity was listed as 555 megawatts. Thus a net generation of 2,430,900 megawatt-hours was calculated as follows:
555 MW × 50% capacity factor × 24 hours per day × 365 days per year = 2,430,900 MWh per year
This value was used for comparison with the actual 2009 generation.
The 2009 gross generation for the subject was 76,090 MWh. It is important to note that the 2009 current generation is significantly less than the historical net generation at which the facility has operated.
This generation data allowed the plant’s current generation to be compared with its design generation to quantify the amount of inutility inherent in the subject.
Inutility is calculated as a ratio of the current capability to the design capability, as explained in the M&TS Committee textbook.[4] The expected net generation of the facility as an intermediate- or base-load plant operating at a 50% capacity factor was used as the design capability of the plant in the inutility calculation. Inutility, or EO, is calculated using the following formula:
Inutility = 1 – (Current Generation ÷ Design Generation)^0.6
The current generation for the subject was the actual annualized 2009 generation. This current level of generation is indicative of expected future generation. This generation was compared with the design generation. The relationship was taken to the 0.6 power, a scale factor that reflects the geometric relationship of cost to capacity based on an analysis of natural-gas-fired generation plants. A similar analysis was performed for the above-mentioned benchmarks. The results of the analysis utilizing various benchmarks were as follows:

Based on the preceding analysis and as shown above, it was concluded that the level of EO from inutility was 75%.
Does this make sense? Further analysis was needed to ensure that the EO conclusion from the inutility analysis was sound.
An analysis of the relationship between supply and demand for energy in the facility’s market further supported the conclusion of 75% EO from inutility. This analysis was performed by calculating a ratio of the actual historical net energy generation (demand) to the maximum possible net generation (supply) in a given period. The following formula is used to calculate the ratio for any given period:
Energy Generation Ratio = Actual Net Generation ÷ Maximum Possible Net Generation
After the analysis of the historical net energy generation for the market from 2005 to 2009 and the calculation of the above-described ratio, a sharp decline in energy demand from 2007 to 2009 was evident, as shown in the following charts:

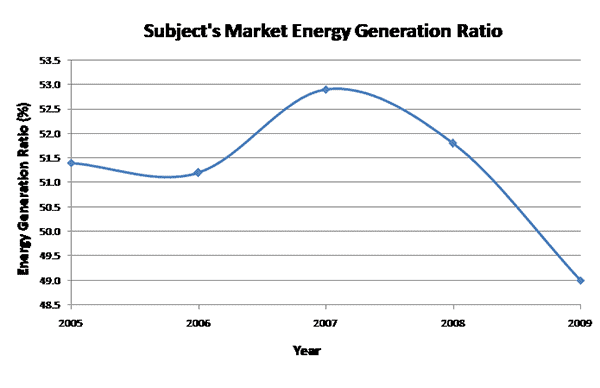
The sharp decline in the energy generation ratio from 2007 to 2009 can be attributed to a decline in energy demand induced by the economic downturn. As a result of the decrease in energy demand, base-load coal and nuclear power plants in the market now can absorb the majority of the demand for energy. Therefore, natural-gas-fired plants similar to the subject facility are forced to operate at a much lower capacity factor, reducing their income-generating capabilities. This supply/demand relationship and the recent decline in demand can be seen in the historical capacity factors of the subject plant. As the energy demand ratio peaked in 2007, the capacity factor for the subject facility also reached a five-year peak at 10.2%. In 2008 and 2009, the energy demand ratio plummeted and so did the facility’s capacity factor, reaching a low of around 1.5%. This capacity factor was expected to remain at low levels into the future. Hence, EO of 75% was determined to be a reasonable conclusion for natural-gas-fired plants such as the subject.
This analysis is summarized in the following table:

Income/Earnings Shortfall Method
As previously mentioned, the income/earnings shortfall is another method to calculate EO. The income shortfall method compares the indication of value from the cost approach, prior to a deduction for EO, to the indication of value from the income approach. The value of the land is generally deducted from the income indicator of value first. The difference between the two approaches is EO. In the case being studied here, all the assets were valued using the cost approach and the effect of EO on the total value applied to all of the assets. While the income shortfall method quantifies all forms of EO in the cost approach, it closely ties the cost approach to the income approach. For that reason, some appraisers argue that with this method, only one approach is actually applied – the income approach. Those appraisers would recognize the income shortfall technique as a good method but would suggest it be used with other supporting analyses of EO.
In this case, use of the income/earnings methodology resulted in an economic obsolescence penalty of $122,300,000, which supported the above quantification of EO at 75%.

Putting it All Together
Once the appraiser has determined that EO exists, analyzed it, and quantified it, the last step is to apply the EO conclusions in the cost approach. This requires logical thinking and support for the process. The appraiser must consider questions such as the following:
- Does it make sense to apply the same or different percentage of EO to all of the assets?
- Does it make sense to apply EO only to certain assets?
- Has the value for some assets been quantified using the income or market approach?
Appraisers must address questions such as these and be able to justify their answers. In this case study example, the derived EO was determined to affect all of the assets associated with power generation. Therefore, the direct EO percentage was applied to all assets in the cost approach.
Based on the results of the cost approach, it was determined that the value of the power plant improvements was $40,700,000.
Conclusion
EO is a negative attribute of an operating property or business that makes it less profitable. Many techniques can be utilized to quantify EO and apply it to income-generating assets. It must be quantified from the market through an analysis of inutility, supply/demand relationships, actual sales transactions, or other indicators of market-based relationships. It is important for appraisers to understand the assets they are appraising and investigate the market in which those assets operate. It is particularly important to realize that every property or collection of assets is unique and can be considerably different from others. Therefore, valuations require the keen insight of experienced appraisers to determine the extent to which economic obsolescence may exist. When EO is identified, a thoughtful analysis of the facts is necessary to apply that EO to the underlying assets to estimate their worth.
Endnotes
- Machinery and Technical Specialties (“M&TS”) Committee of the American Society of Appraisers, Valuing Machinery and Equipment: The Fundamentals of Appraising Machinery and Technical Assets (Washington, DC: American Society of Appraisers, 2011), 172.
- M&TS Committee, Valuing Machinery and Equipment, 78, 79.
- M&TS Committee, Valuing Machinery and Equipment, 81, 82.
- M&TS Committee, Valuing Machinery and Equipment, 79.
This article was previously published in the MTS Journal.