By Clayton T. Baumann, PE, CCP, ASA | evcValuation
Click HERE to download a PDF version of this article
Abstract
This paper discusses the cost-to-capacity method and scale factors that are used in its application. The main focus is the application of the cost-to-capacity method and scale factors in completing order-of magnitude cost estimates for entire industrial facilities and pieces of machinery and equipment. Basic methodology is discussed along with considerations that should be noted before applying the cost-to-capacity method and scale factors. Examples are also presented to provide a better understanding of basic methodologies. While the concepts presented were originally developed more than a half century ago, they continue to be effective tools in developing reliable order-of-magnitude cost estimates. A fundamental understanding of the cost-to-capacity method and scale factors should be obtained by all professionals involved in the development of cost estimates.
Introduction
The cost-to-capacity method: What is it, and how is it applied? The concepts and methodology behind the cost-to-capacity method are not overly complex. Yet, the method is often not fully understood, and thus it is applied in an inappropriate and inconsistent manner in various cost estimating analyses.
In the early stages of nearly any project, cost estimates are needed in order to make educated decisions going forward. Specifically, the economic viability of a project must be sufficiently supported in order to move forward in the planning process. The cost-to-capacity method is an effective tool that can be used to quickly perform required cost estimates and can be applied to both overall industrial facilities, and individual pieces of industrial machinery and equipment (“M&E”).[1]
This paper discusses the cost-to-capacity method as well as scale factors that are used in its application. More specifically, applications of the cost-to-capacity method in cost estimation modeling for various types of industrial facilities (or M&E) are discussed. Basic methodology and pertinent factors related to the application of the cost-to-capacity method in cost estimation modeling are presented, along with an example. The correct application of scale factors in the cost-to-capacity method is then discussed, along with applicable methodology and a scale factor derivation example.
Cost-to-Capacity Methodology
The cost-to-capacity method is an order-of-magnitude cost estimation tool that uses historical costs and capacity in order to develop current cost estimates for an entire facility or a particular piece of machinery or equipment.[2] The cost-to-capacity concept was originally applied in 1947 by Roger Williams Jr. to develop equipment cost estimates; later, in 1950, C.H. Chilton expanded the concept’s application to estimate total chemical plant costs.[3]
Cost estimates developed by the cost-to-capacity method can be classified as Class 5 or Class 4 estimates as indicated by the Association for the Advancement of Cost Engineering (“AACE”) International.[4] Per AACE International, there are five classes of estimates from 1 through 5. Both Class 5 and Class 4 estimates are preliminary in nature and are based on limited information, while a Class 1 estimate is highly detailed and based on a fully defined project scope.[5]
The fundamental concept behind the cost-to-capacity method is that the costs of facilities (or pieces of M&E) of similar technology but with different sizes vary nonlinearly. More specifically, cost is a function of size raised to an exponent or scale factor.6 The governing equation is as follows:

Equation 1[6]
The raised scale factor in Equation 1 above accounts for the nonlinear relationship and introduces the concept of economies of scale where, as a facility (or piece of M&E) becomes larger, the incremental cost is reduced for each additional unit of capacity.[7] However, not all facilities (or pieces of M&E) actually experience economies of scale related to costs. A scale factor of less than 1 indicates that economies of scale exist and the incremental cost of the next added unit of capacity will be cheaper than the previous unit of capacity. When the scale factor is greater than 1, economies of scale do not exist; rather, diseconomies of scale exist and the incremental cost becomes more expensive for every added unit of capacity. A scale factor of exactly 1 indicates that a linear relationship exists and there is no change in the incremental cost per unit of added capacity.[8] A scale factor of 1 also indicates that it is just as economically feasible to build two small facilities as one large facility with the same capacity.[9]
Cost-to-Capacity Method Application Considerations
One of the main advantages of the cost-to-capacity method is its relatively easy application. It can be applied to quickly develop reasonable order-of-magnitude cost estimates. Potentially even more useful is its capacity to allow sensitivity analyses to be quickly performed when high degrees of accuracy are not required.[3] However, there are a number of considerations that must be addressed prior to applying the cost-to-capacity method.
To obtain reasonable results, the technology of the facility (or M&E) for which the cost is being estimated must be the same as, or very close to, that of the facility (or M&E) with a known historical cost. Likewise, the scale factor that is applied must appropriately reflect both the technology of the known and cost-estimated facilities (or M&E). As will be explained in more detail in a subsequent section, the scale factor that is used should also be specifically applicable to the range of sizes for the specific technology of facility (or M&E) being analyzed.
In addition to technology, the analysis must consider the configuration of the facility (or piece of M&E), its location, and any unique design and site characteristics. Differences in location would almost always require the application of a locational cost adjustment factor due to factors that include but are not limited to regional differences in skilled labor rates (union vs. nonunion), material costs, equipment costs, and general site condition costs (rural vs. urban). Likewise, different configurations or unique design or site characteristics would require a cost adjustment prior to completing the cost-to-capacity analysis which could include construction material differences, atypical off-site assets, and government mandated environmental control and monitoring equipment which vary by state or region, to name a few. Significant deviation between the known and estimated facilities (or M&E) in any of the aforementioned categories can yield non-meaningful cost estimate results.[7]
Lastly, prior to applying the cost-to-capacity method, the known historical costs that have a specified reference year must be adjusted for inflation in order to develop a correct cost estimate for the required year. For example, it may be required to develop a cost estimate for a piece of industrial equipment in current dollars but the known costs are based on 2010 dollars. In general terms, to appropriately account for the effects of cost inflation, the known historical cost must be escalated using cost indices applicable to the technology in question.[7] The known historical cost with a specified reference year must be multiplied by a ratio of the index of the required year’s cost and the index of the reference year’s cost.[6]
The following equation illustrates the general relationship:

Equation 2[6]
It should be noted that using indices to escalate historical costs should be approached with some caution. The older the historical costs are, the greater potential they have to diminish the accuracy of the estimate. Thus, historical cost estimates that are escalated using Equation 2 should be analyzed to determine whether the cost vintages are still relevant. Using historical costs that are as current as possible will typically yield more meaningful results.[6]
Some commonly used, cost indices that can be applied to industrial facilities and M&E include the following: Handy-Whitman Index of Public Utility Construction Costs, Engineering News-Record (“ENR”) Construction Cost Index, Nelson-Farrar Refinery Cost Index, IHS Downstream Capital Cost Index (“DCCI”), Chemical Engineering’s Plant Cost Index, Marshall and Swift (“M&S”) Cost Index, and various indices published by the US Bureau of Labor Statistics (“BLS”).
Cost-to-Capacity Method Example
In order to better illustrate the previously discussed concepts and methodologies, a simple application example of the cost-to-capacity method is given below:
An order-of-magnitude cost estimation is needed for a proposed 1,240-megawatt (“MW”) combined cycle power plant, as of January 2013. Research indicates that a combined cycle power plant with a capacity of 620 MW with the same technology had construction completed in 2011 in the same regional area. The total cost of the existing plant in 2011 dollars was approximately $580,000,000. It is determined that, in addition to being located in the same region, the existing plant is almost identical to the proposed plant in terms of overall design, with the exception of having fewer units. Thus, it is concluded that the historical cost of this plant is a good reference for the required cost estimation. Because the existing plant is located in the same regional area, no locational adjustment is required; further, the almost identical design requires no additional cost adjustment for unique design characteristics. The only adjustments that need to be taken into account in this cost estimation are cost inflation and size scaling.
First, the 2011 dollars must be converted to 2013 dollars. An applicable index related to costs associated with combined cycle power plants must be referenced. An appropriate index indicates a 2011 index value of 1.56 and a 2013 index value of 1.76. Thus, the 2011 historical cost must be escalated to 2013 dollars per the previously introduced Equation 2, as shown below:

Next, the escalated cost must be scaled to account for the difference in size between the proposed plant and the existing plant. As derived from 2012 Gas Turbine World Handbook (“GTW”) data in a subsequent section of this paper an appropriate scale factor to apply in cost estimates for combined cycle power plants is 0.82. The previously introduced Equation 1 can now be mathematically manipulated and solved as follows:

As represented by the above cost estimate example, a size increase of 2 times results in a cost increase of approximately 1.77 times. This expresses the previously introduced concept of economies of scale inherent in applying a scale factor of less than 1. Similarly illustrated is the fact that as the capacity of the power plant in this example increases, it becomes incrementally cheaper for each additional unit of added capacity.
Scale Factor Derivation Methodology
One of most crucial components when applying the cost-to-capacity method is an appropriate scale factor. The previously mentioned study performed by C.H. Chilton in 1950 derived a common scale factor for chemical facilities of approximately 0.6, which led to the cost-to-capacity method being referred to early on as the “six-tenths rule”.10 Since the Chilton study, many other sources have published scale factors for various pieces of industrial equipment and entire facilities of certain technologies. Some scale factor sources include “Process Plant Estimating Evaluation and Control” by Kenneth M. Guthrie published in 1974, “Quality Guidelines for Energy System Studies, Capital Cost Scaling Methodology” published by the U.S. Department of Energy in 2013, and the current edition of IHS Chemical Process Economics Program. However, the majority of scale factors that are published do not provide supporting industry data and derivations. When using published scaled factors multiple sources should be referenced in order to make certain a reliable figure is applied in any cost-to-capacity analysis.
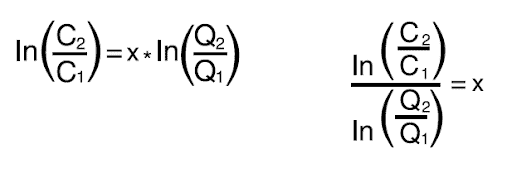
The methodology for deriving a scale factor is not much more complex than the cost-to-capacity method and the previously presented Equation 1. If cost and capacity data are known for two different facilities (or pieces of M&E) with the same technology and design, then the scale factor can be derived. Equation 1 can be transformed by applying natural logarithms to the cost and capacity data on both sides of the equation to develop a linear relationship. It can then be further manipulated to solve for the scale factor, x. The below equations show this relationship. (Refer to Equation 1 for variable definitions.)

The above relationship outlines the basic concept behind the development of a linear relationship and the derivation of a scale factor. However, in order to derive a more accurate scale factor for a particular facility (or piece of M&E) with a certain technology, an entire set of industry cost and capacity data must be analyzed. To accomplish this, natural logarithms can be applied to an entire set of cost and capacity data and then graphed. A linear regression analysis of the natural logarithm of the cost and capacity data can then be performed using graphing computer software. The resultant linear regression line slope is the representative scale factor for that particular type of facility (or M&E) with a specific technology).[8]
It is important that the cost and capacity data that is gathered and analyzed in the linear regression analysis is consistent with respect to design parameters such as technology, configuration, location, and unique site characteristics. These are similar to the considerations of the cost-to-capacity method, as previously stated.
Scale Factor Derivation Example
The previously described scale factor derivation method using regression analysis is best illustrated by an example. The example again involves combined cycle power plant technology, as introduced in the previous example of the basic cost-to-capacity method.
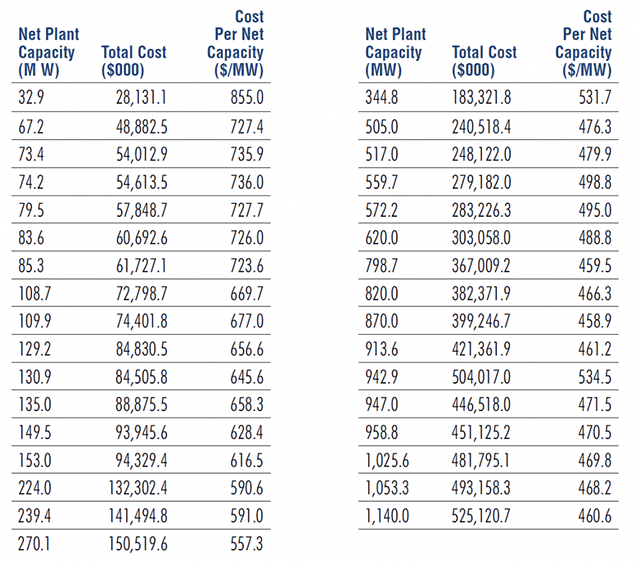
Table 1 below shows the net plant capacity in megawatts and associated total cost and cost per net capacity in 2012 dollars for certain combined cycle power plants per GTW. This data set was developed by GTW in a consistent manner based on contractor pricing and basic manufacturer designs, in which the location basis, technology, configuration, and costs considered are the same. Thus, it is a good source for deriving a scale factor for a combined cycle power plant.

Table 1 – Combined Cycle Power Plant Capacities and Costs[11]
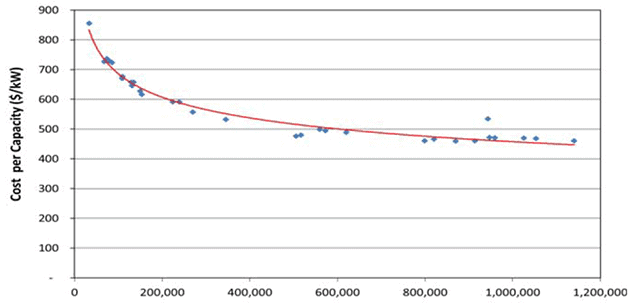
Table 1 clearly illustrates a declining trend in the cost per net capacity as the size of the plant increases. This indicates that economies of scale exist when constructing larger combined cycle power plants. Figure 1 below shows the declining cost per net capacity relationship.

Figure 1 – Combined Cycle Power Plant Cost per Net Capacity vs. Net Capacity[11]
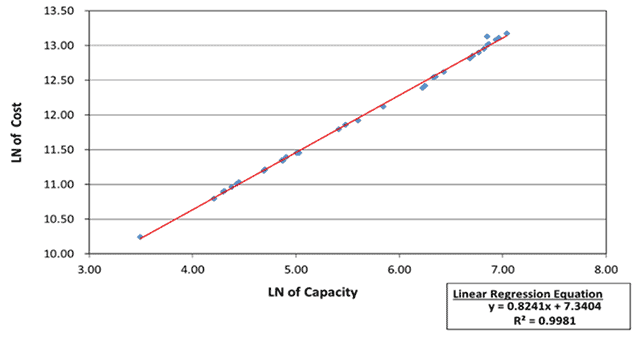
The relationship of economies of scale that exists for combined cycle power plants is what is captured when deriving the scale factor for the above data set. As previously described, in order to derive a scale factor from the above data set, natural logarithms are applied to both the total cost and capacity data and then graphed. A linear regression analysis is then performed on the natural logarithm of the total cost and net capacity to derive a linear regression equation. Figure 2 below shows a graph of the Figure 2 – Combined Cycle Power Plant Total Cost vs. Capacity Regression Analysis natural logarithm of the total cost and capacity data from Table 1, along with the resultant linear regression equation.

Figure 2 – Combined Cycle Power Plant Total Cost vs. Capacity Regression Analysis
Per the linear regression equation shown in Figure 2 above, the slope of the line is 0.8241. As previously discussed, this slope is representative of the scale factor for the given set of analyzed data. Thus, the scale factor for the combined cycle power plants analyzed is concluded to be approximately 0.82.
R^2 values calculated in linear regression analyses are indicators of how closely a linear regression line approximates a given set of data. The closer the R^2 value is to 1, the better the regression line estimates the data set. By visual inspection, the linear regression equation appears to closely match the set of data. Furthermore, the R^2 shown in Figure 2 above is 0.9981, indicating that the linear regression equation is almost ideally approximating the data set.
Scale Factor Considerations
It should be noted that the previous scale factor derivation is a simplified example in that one scale factor was derived for a broad range of capacities for combined cycle power plants. In many cases, depending on the type of technology of the particular facility (or piece of M&E), the scale factor increases at certain ranges of capacity due to fixed increases in costs for larger equipment sizes.[12] It could be the case that if a particular cost and capacity data set is broken down into smaller subsets and a scale factor derivation is performed, the resultant scale factors for the larger capacity subsets would be greater than the smaller capacity subsets. Thus, caution should be used when deriving a single scale factor based on broad ranges of capacity for a particular facility (or piece of M&E). Likewise, the fact that scale factors may vary over ranges of capacity should warrant the same level of caution when applying a single scale factor in cost-to-capacity analyses for a broad range of facility or equipment sizes. Utilizing a scale factor that is too large or too small will lead to less reliable cost estimate results. The accuracy of the scale factor has a direct impact on the accuracy of the cost estimation that is being developed by a cost-to-capacity analysis.
Conclusion
The cost-to-capacity method allows cost estimates to be developed on the basis of historical cost and capacity information for similar facilities. It does not involve complex computation and is relatively easy to use. However, the cost-to-capacity analysis must be applied in a consistent and appropriate manner in order to produce meaningful cost estimate results.
Technologies and various design parameters and characteristics related to a particular facility (or individual piece of M&E) for which a cost-to-capacity analysis is being applied must be closely analyzed. Required inflationary adjustments and locational adjustments must also be considered. An appropriate scale factor that is representative of the technology in question must be applied in the cost-to-capacity analysis to yield reliable results. In deriving an appropriate scale factor, an entire set of cost and capacity data is required to be compiled on a consistent basis for the specific facility (or M&E) in question. The limitations of deriving and applying a single scale factor for a broad range of facility (or M&E) sizes in the cost-to-capacity method must be understood.
When all the necessary factors are considered, the cost-to-capacity method can yield useful cost estimate results. Specifically, it can provide quick and reliable order-of-magnitude cost estimates when only a limited project scope is known, which can be critical in determining the economic feasibility of a project. Thus, the cost-to-capacity method is a highly effective tool in developing cost estimates both for entire facilities, and for individual pieces of industrial machinery and equipment.
Endnotes
- Chilton, C.H., “Six-Tenths Factor Applies to Complete Plant Costs,” Chemical Engineering, vol. 57, pp. 112-114.
- Ellsworth, Richard K., “Capacity Factor Cost Modeling for Gas-Fired Power Plants,” Construction Accounting & Taxation, vol. 19, no. 1, Jan/Feb. 2009, p. 31.
- Remer, Donald S., “Design Cost Factors for Scaling-up Engineering Equipment,” Chemical Engineering Progress, August 1990, p. 77.
- AACE International Recommended Practice No. 17R-97, “Cost Estimate Classification System,” AACE International, Morgantown, WV, November 29, 2011, pp. 2-3.
- AACE International Recommended Practice No. 10S-90, “Cost Engineering Terminology,” AACE International, Morgantown, WV, April 25, 2013, pp. 25-26.
- Humphreys, Kenneth K., Jelen’s Cost and Optimization Engineering, McGraw-Hill, Inc., New York, NY, 1991, pp. 382-383, 386.
- U.S. Department of Energy, National Energy Technology Laboratory, Office of Program Planning & Analysis, Performance Division, “Quality Guidelines for Energy Systems Studies, Capital Cost Scaling Methodology,” January 1, 2013, pp. 1-4. Retrieved from http://seca.doe.gov/energy-analyses/quality_guidelines.html.
- Ellsworth, Richard K., “Cost to Capacity Factor Development for Facility Projects,” Cost Engineering, vol. 49, no. 9, Sept. 2007, p. 27.
- Dysert, Larry R., “Sharpen Your Cost Estimating Skills,” Cost Engineering, vol. 45, no. 6, June 2003, p. 23.
- Ellsworth, Richard K., “Cost-to-Capacity Analysis for Estimating Project Costs,” Construction Accounting & Taxation, vol. 15, no. 5, Sept./Oct. 2005, p. 6.
- Gas Turbine World 2012 GTW Handbook, Pequot Publishing, Inc., Southport, CT, 2011, pp. 51-54.
- Chase, David J., Modern Cost Engineering: Methods and Data, McGraw-Hill Publishing Co., New York, NY, pp. 228-229.
This article was previously published in the MTS Journal.
